DATA PAGE
Prince George’s County Public Schools
A Watershed of Trees MWEE
DATA COLLECTION
Printable data collection sheet: download HERE (pdf, 37 kB)
Psychrometric Table (for relative humidity and dewpoint) (pdf, 1.5 MB)
NOAA Heat Index Chart
NOAA Heat Index Calculator
SHARE YOUR DATA
FIND DATA

NOTE: These data sets have been collected by students for education purposes, and are not intended for legal or permitting decision-making purposes.
PGC MWEE Newsletter
Find teaching tips, looks at student data, and news.
February 2023 (pdf, 1.9 MB)
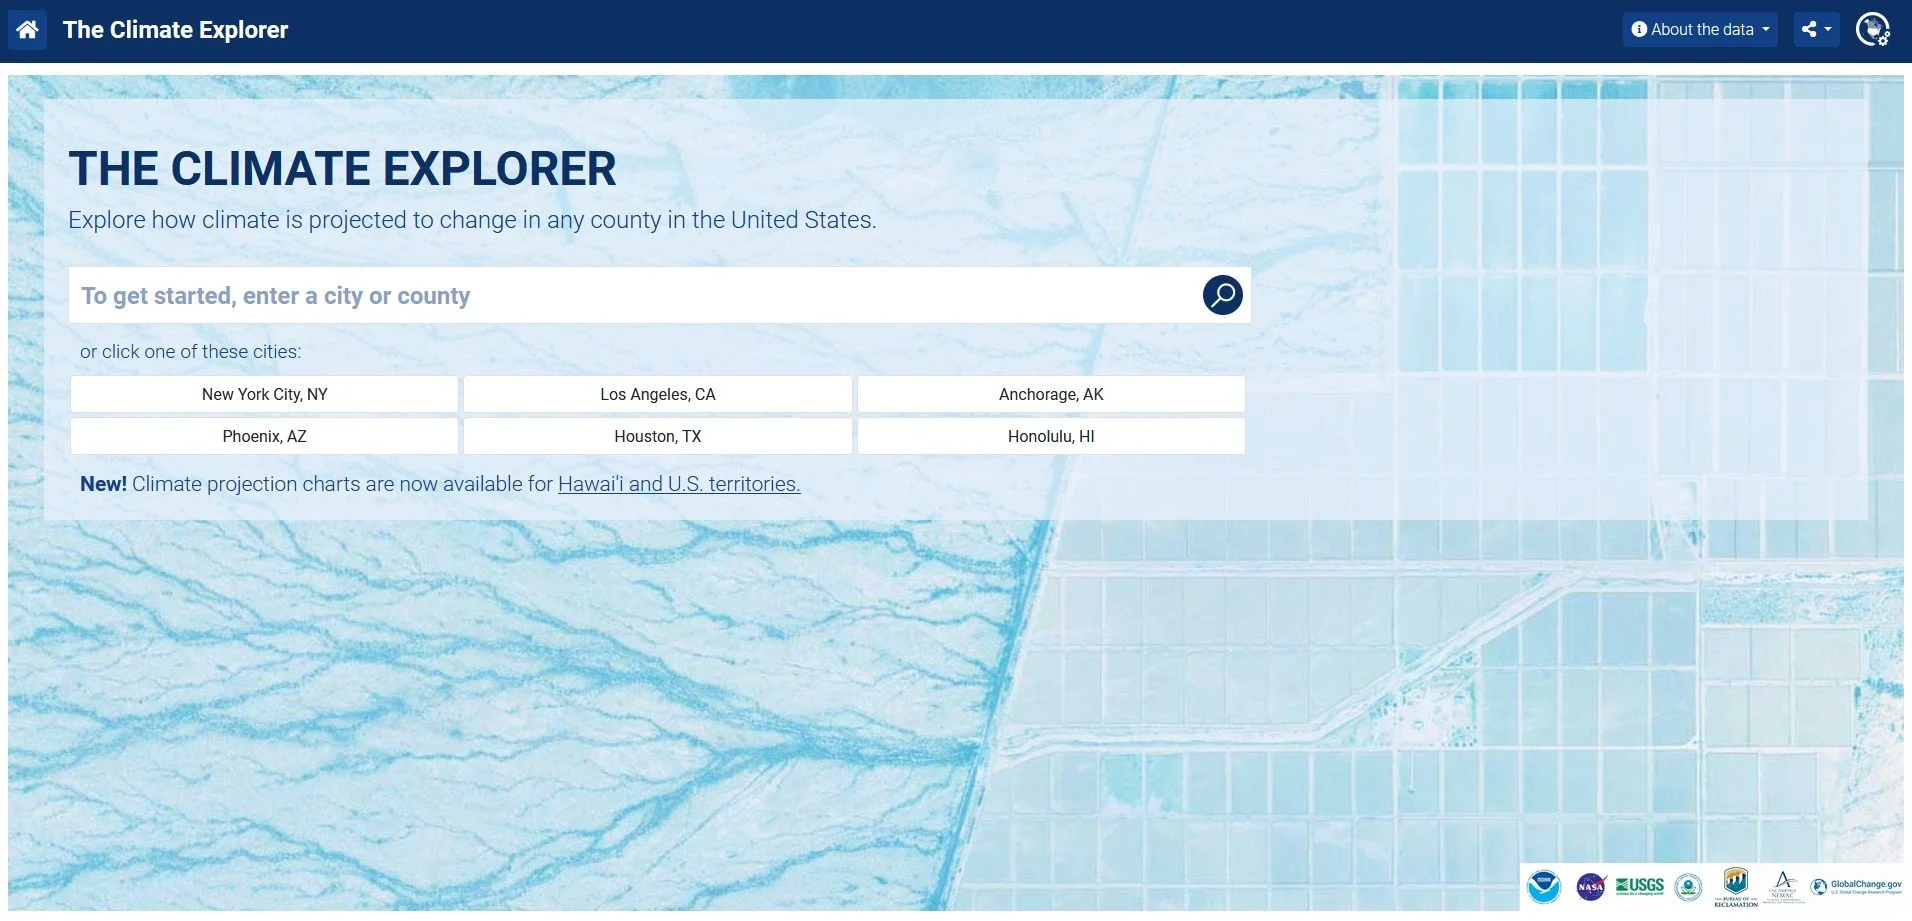
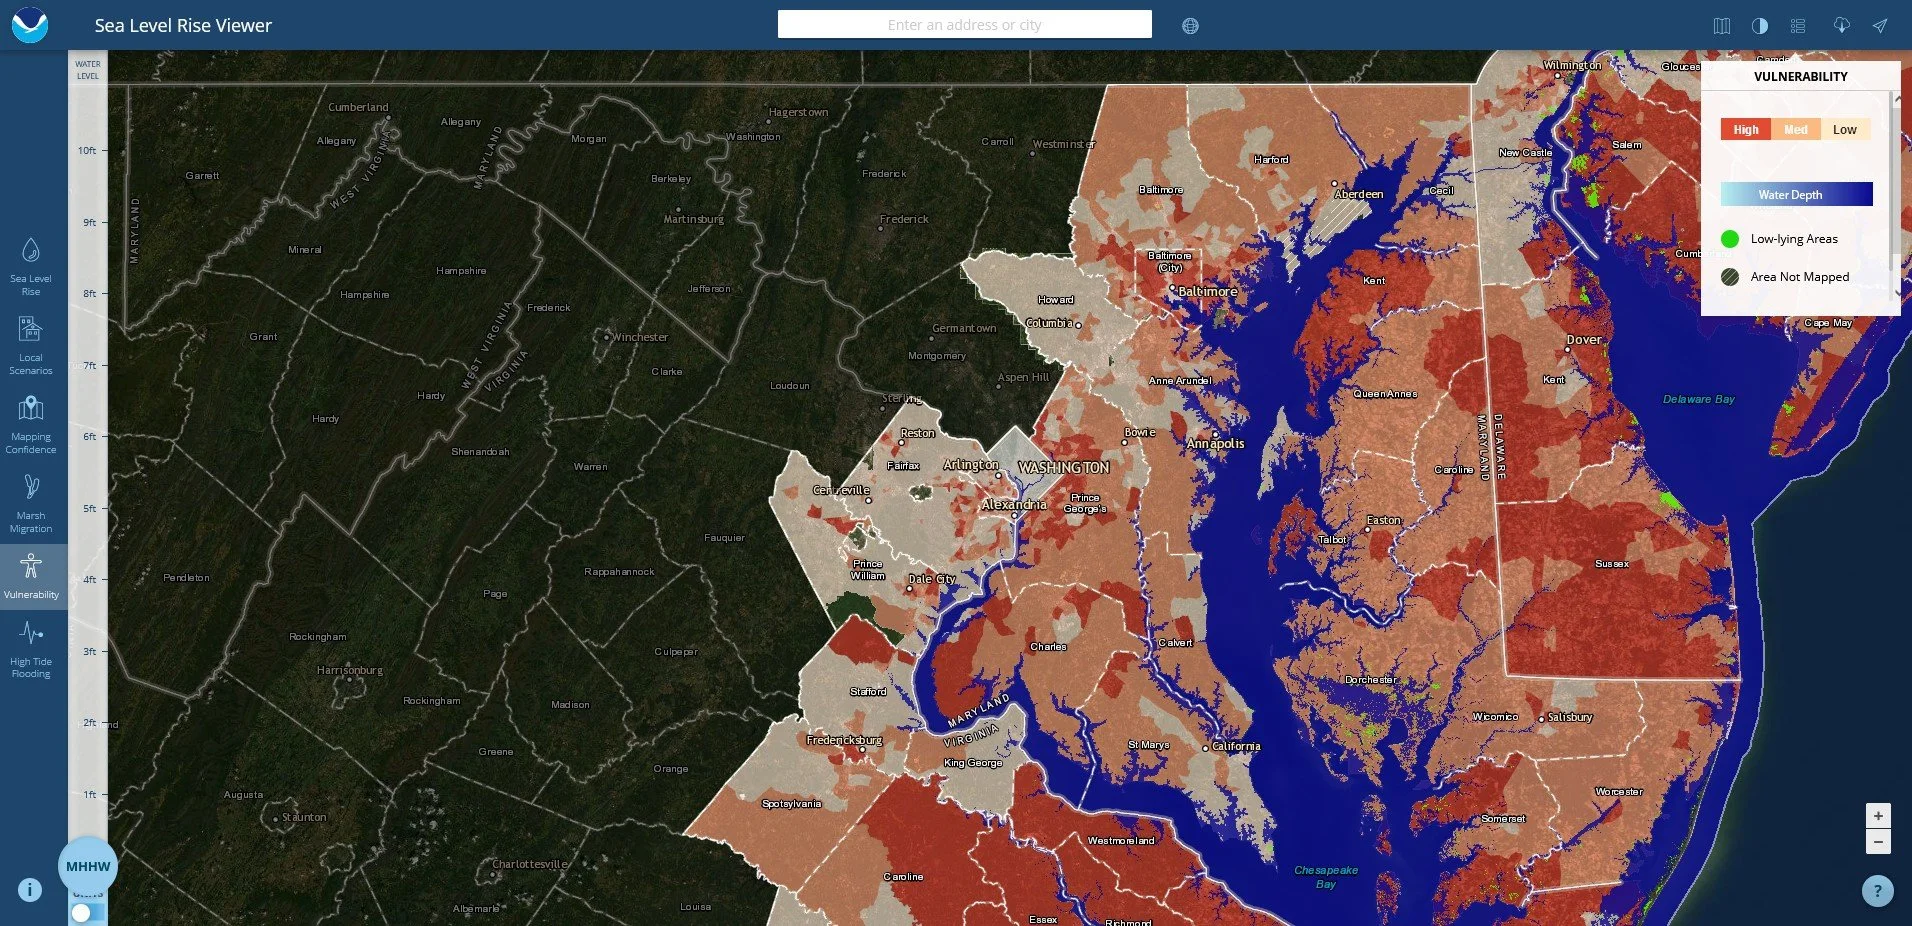
Resources from the National Oceanic and Atmospheric Administration (NOAA)
Featured
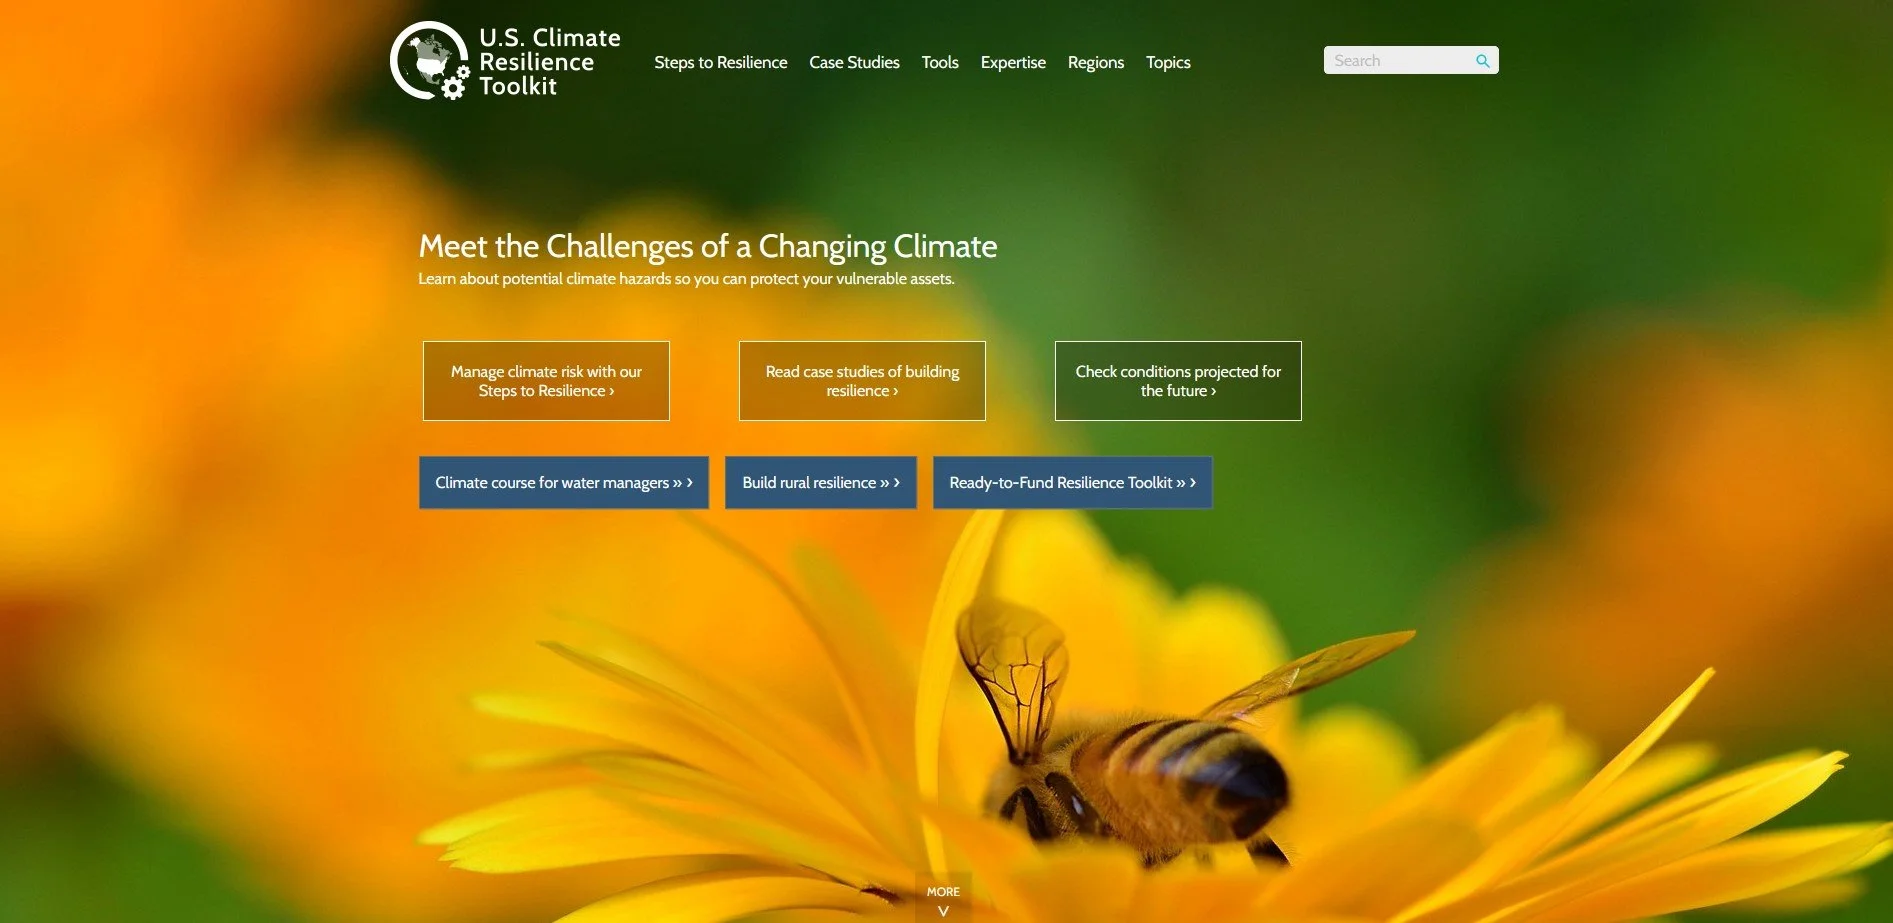

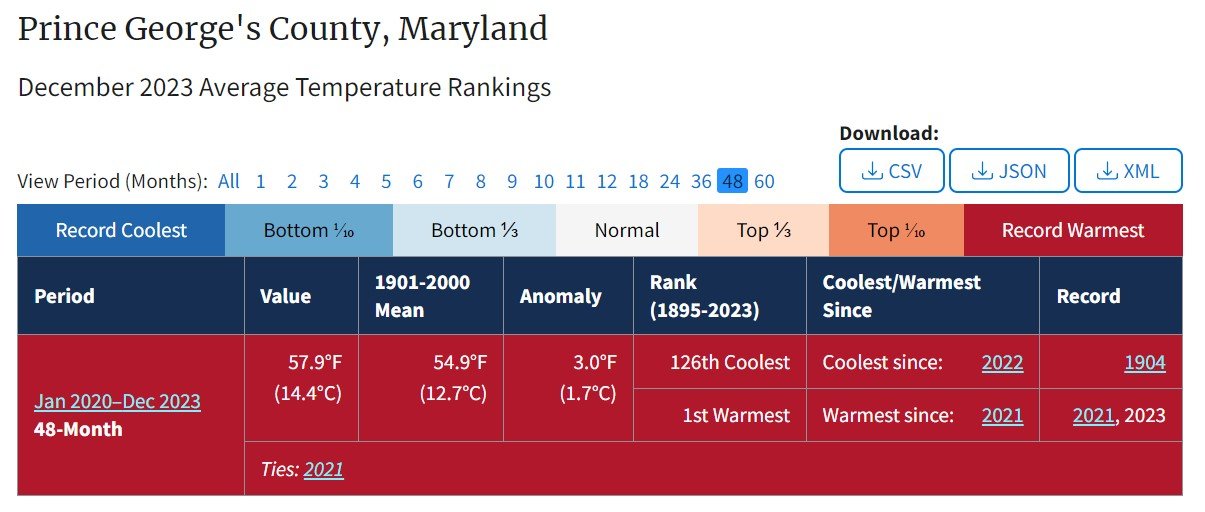
Other Resources
Featured