Through the Eyes of the Experts: Precipitation in a Changing Climate with Dr. Angie Pendergrass
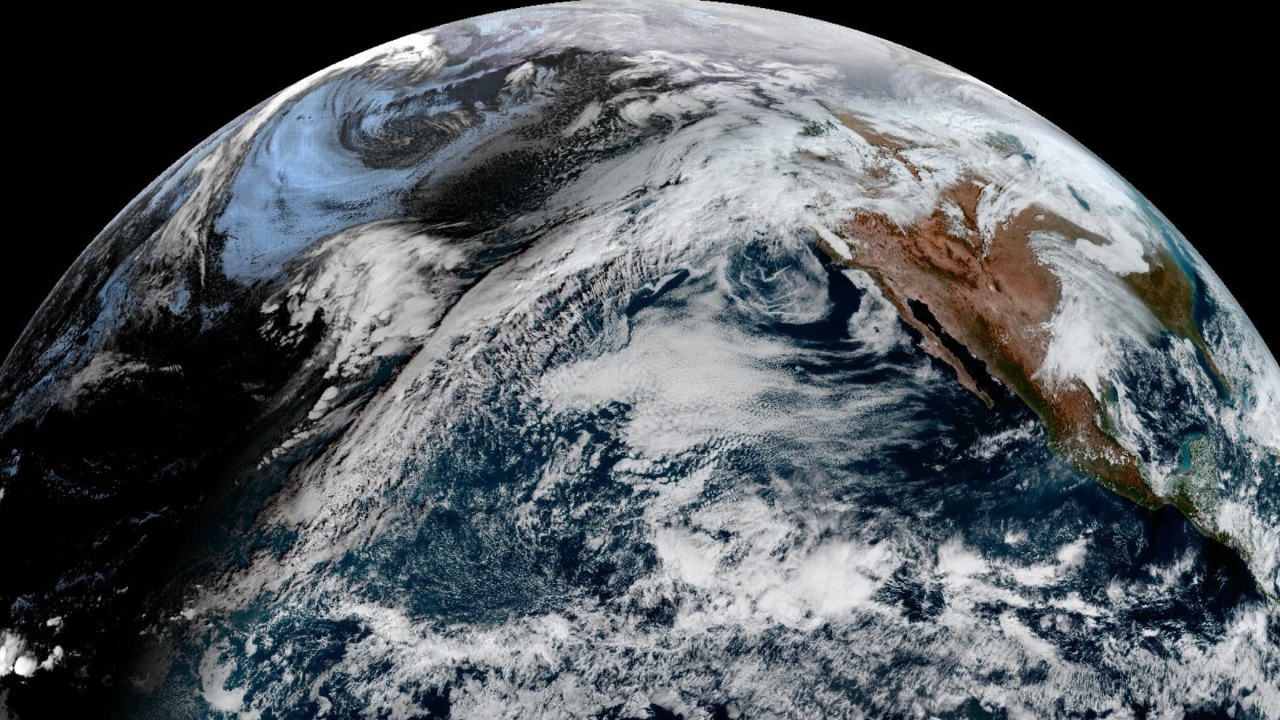
CIRA/NOAA GeoColor Satellite Image of the Western Hemisphere from GEOS West on Dec 16, 2025
By Dr. Toby Ault, Associate Professor in Department of Earth and Atmospheric Sciences at Cornell University and PRI Research Associate
March 4, 2026; Originally published December 16, 2025 on LinkedIn
Through the Eyes of Experts
On the Wednesday before Thanksgiving, I met up with Cornell University’s Dr. Angeline Pendergrass, an internationally recognized expert in the physics, modeling, and observations of global precipitation. She had just gotten back from the world-famous (in Ithaca) Wide Awake Bakery, with a few loaves of bread and a gingerbread cookie she shared with me. We drank tea at her dining room table and talked about our respective pathways into science before getting into her views on what differentiates the novice from the expert (in a nutshell: the novice is confident while the expert is circumspect).
Approximately Forever
Angie had wanted to be a scientist “for approximately forever,” and it struck me in our conversation that the best scientists often have threads of their own personal experience stitched into the research questions they ask. Growing up in Indiana, she remembers severe weather warnings and tornadoes: “two of them hit the neighborhood pool where I spent every summer, and one happened on my birthday.” Later, when her family moved to the west side of Lake Michigan, she immediately noticed how different the winters were, because she was no longer in the path of lake-effect snow. Both her parents were scientists, so the idea of becoming one felt a bit like 'the family business.' We learned that our grandparents both grew up paddling on the shores of Lake Michigan and joked that maybe they passed each other in a canoe at some point over a century ago.
No Sweat?
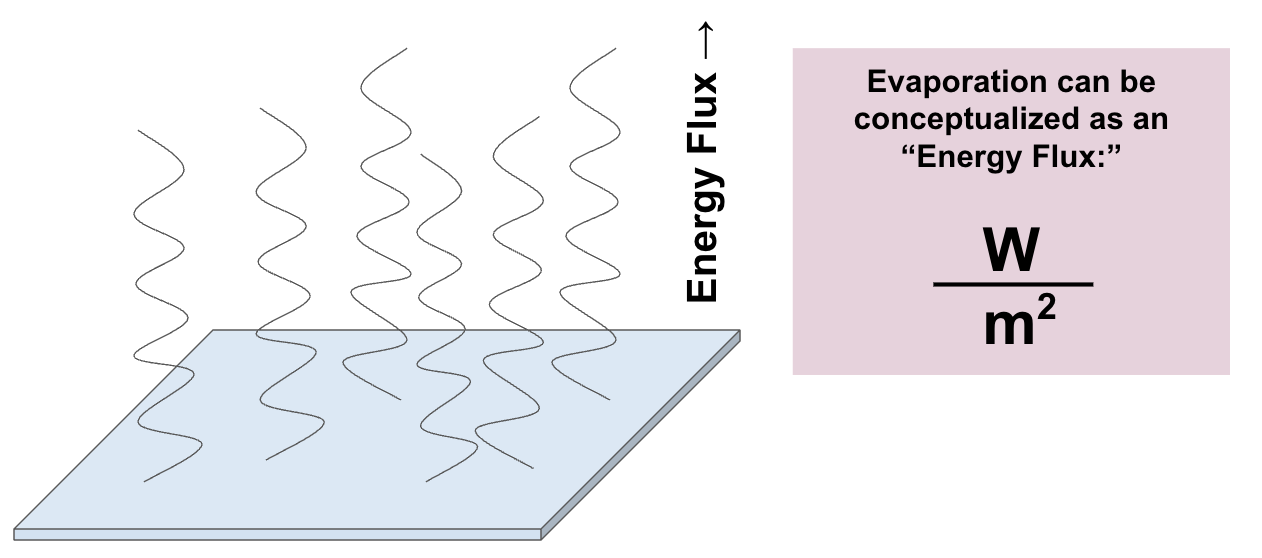
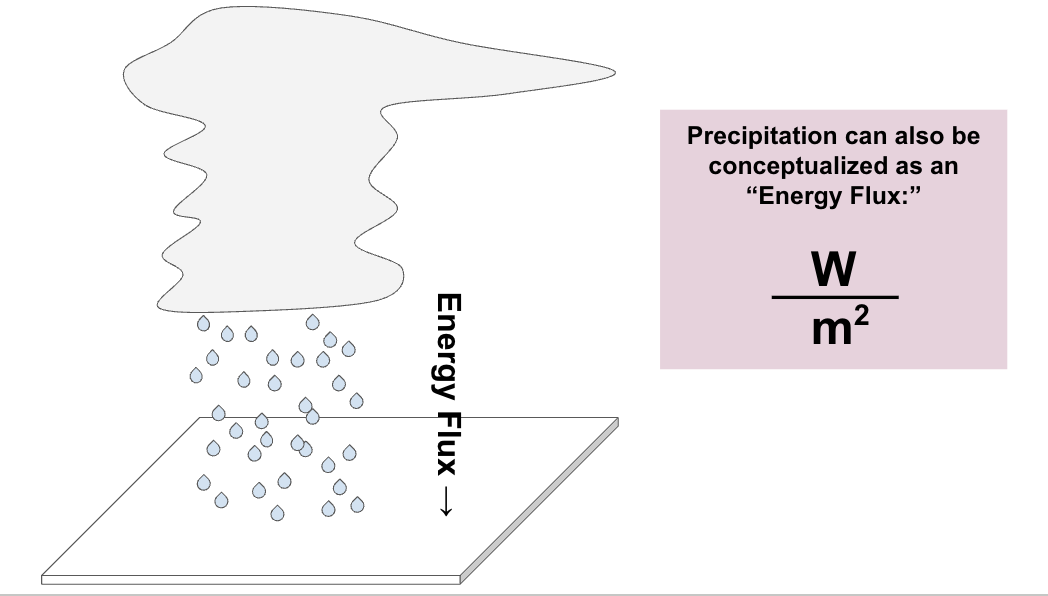
Angie mentioned in passing a point that may surprise you: average global rainfall rates can be quantified in units of Watts (like you’d see on a lightbulb) per square meter. How? Everyone is familiar with the idea that evaporation causes cooling: it’s why we sweat, and it’s why a dry parking lot feels hotter in summer than a patch of grass. But for one kilogram of water to evaporate, you need about 2260 kJ of energy, which means that evaporation rates can be conceptualized as energy fluxes. As such, we can think of evaporation rates in units of joules per second, or more commonly, watts per square meter. Since what goes up must come down, we can also think of rainfall rates as being equivalent to energy fluxes (again in watts per square meter)
“If you convert global precipitation into watts per square meter,” Angie exclaimed, “the observational datasets differ by something like ten! They differ by ten!”
In a field where researchers argue fiercely over tenths of a watt, that kind of discrepancy is enormous. It was my first glimpse into what Angie meant when she said that novices don’t yet appreciate how complex, interwoven, and challenging these problems really are.
“Suppose I’m a Master of Engineering student from another department,” I said, “and I’m technically competent. Maybe I was a math or CS major:I know Python, SQL, I’ve taken machine learning, I can fit distributions to data like a baker makes bread. Let’s say I’m working on a project for a company that wants to design crop-insurance packages for farmers in the Caribbean. I’ve collected about twenty years of daily precipitation data from a station like Port-au-Prince, and my job is to estimate the risks of the 1-in-10, 1-in-100, and even 1-in-1000-year rainfall events. So I’m fitting a GEV to the data to get those numbers.”
Angie cocked her head to the side, already exasperated because she knew where this was going, “Remember this is just a character I am playing!” I interjected.
“You don’t have nearly as much data as you think, Toby!” She said, “Twenty years of daily observations might feel like a lot because you have twenty times 365 numbers, but if what you care about are the really heavy events, you only have about twenty of those. That’s barely enough to do linear regression with a well-behaved, normally distributed dataset—let alone estimate extremes.” Tropical rainfall is particularly noisy, extremes are rare by definition, and the statistical shape of the tail is not something you can readily infer from a handful of points, especially if you don’t know anything about the underlying physical processes (sometimes called the “generating processes”) that are responsible for those tails.
For a student hoping ERA5 would rescue a Caribbean time series with data gaps during major hurricanes, this was another dead end. Using reanalysis to estimate extremes wasn’t going to solve the missing-data problem; it would only mask it behind a more sophisticated façade. ERA5 could help with many things (circulation patterns, moisture transport, large-scale dynamics), but not with the very quantity I was trying to model.
My character had one more trick up his sleeve. I reminded her that I was playing a character once again, and then proceeded to say, “I’m also using CMIP6 and the large ensemble to update the distributions every year. And downscaling. Our potential clients love it,” I said.
“I’ll bet they do,” she replied, without missing a beat.
Model Genealogy
She reminded me of one of my favorite papers of the last few years, the one that shows why treating CMIP models as independent samples is such a profound mistake. The models may look distinct on paper, but under the hood, they share code, parameterizations, tuning philosophies, and even ancestry. They come from a small number of original families—branches sprouting from the same few trunks—and so the “thirty-six models” my fictional student was combining into a single population did not contain thirty-six degrees of freedom. It was more like eight or ten. Updating a rainfall distribution every year by pooling all available models together wasn’t multiplying information; it was amplifying the illusion of information.
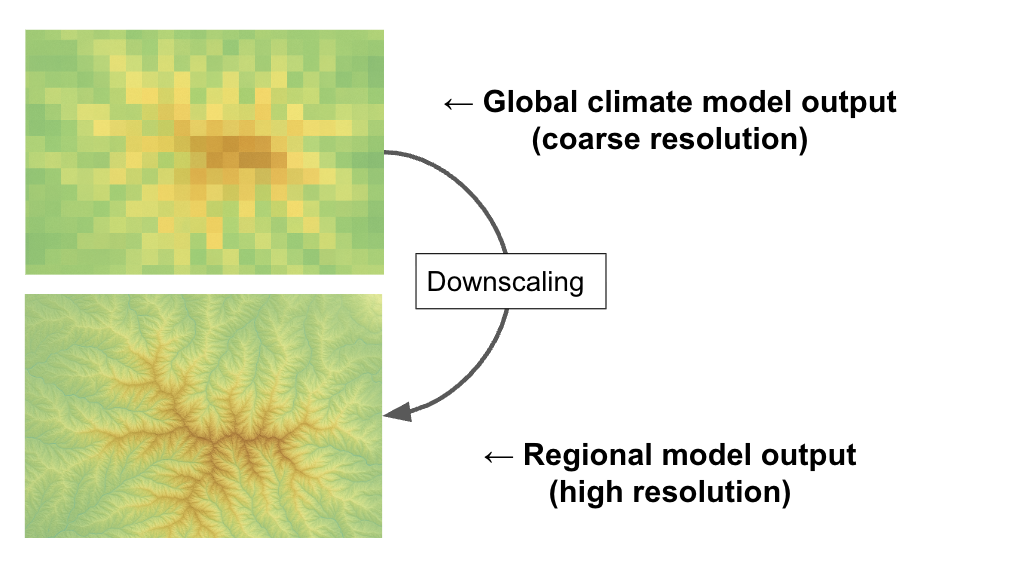
“Not only that,” Angie continued, “but downscaling isn’t going to save you either.” Statistical and dynamical downscaling, she explained, have spent years in a kind of quiet rivalry (think “Montagues and Capulets”) each claiming to deliver the fine-scale detail stakeholders crave. But both approaches inherit the biases, structural assumptions, and errors of the underlying model, which means that whatever illusions of precision my fictional student thought he was generating at one kilometer were still rooted in the coarse, uncertain physics of the parent model. “If the large-scale model has too much precipitation,” she said, “the downscaled product will have too much precipitation. If the model gets the tail wrong, the downscaled tail is wrong.” The resolution may be finer, the maps prettier, but the underlying information content had not magically increased.
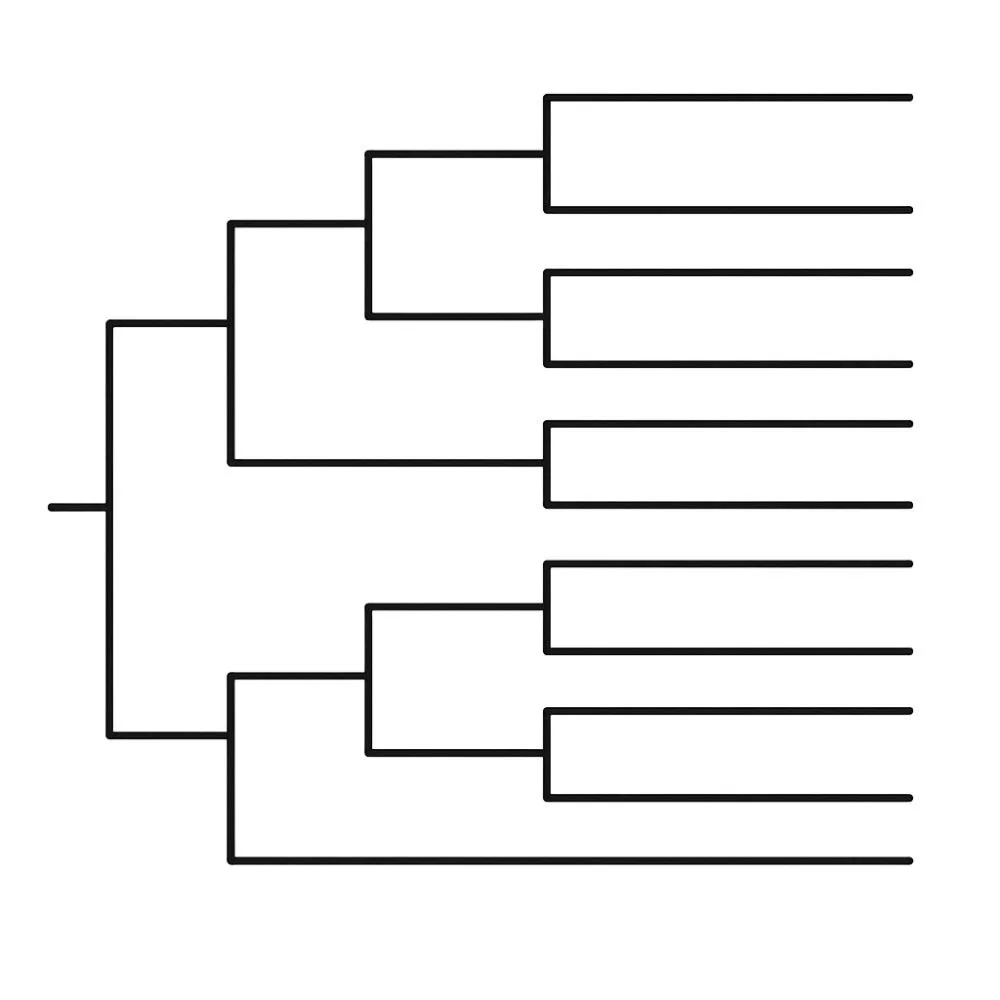
She went on to explain why this mattered for anyone trying to turn CMIP output into a meaningful probability distribution. You don’t even need to know the genealogy of the models, their shared code, tuning choices, or institutional lineage. A recent paper that Angie co-authored (the one I mentioned above) shows that you can use the statistics of the model outputs themselves to determine how similar or independent they are. The concept is similar to a phylogenetic tree: models that behave alike cluster together, while those that bring genuinely distinct information stand apart.
Once you quantify model independence, you can weight the models accordingly. Models that are effectively twins—producing the same patterns for the same underlying structural reasons—each receive only a fraction of a vote, while models that supply unique information count more. The entire purpose is to prevent exactly what my fictional student was doing: mistaking a large population of models with similar behaviors for an enormous population of independent samples.
“There are times when downscaling is a necessity,” she went on, “but if you’re going to downscale you have to understand what it is doing.” Downscaling is appropriate when you need finer spatial representation of a model’s large-scale signal, and inappropriate when you expect it to repair model biases, increase statistical power, or yield reliable estimates of extremes.
In the spirit of mentoring my misguided character, Angie pointed out that in some regions, the models are reliable when it comes to predicting the relative (as opposed to absolute) forced changes in precipitation. The direction of change, the broad pattern, the shift in intensity—those signals can sometimes be physically interpretable. But she emphasized that on the time horizons most people care about, especially anything shorter than several decades, the forced signal is usually tiny compared with the noise. Year-to-year swings in precipitation are so large, and the internal variability so strong, that the long-term change a model is trying to convey is often buried beneath it. “It’s not that the models are useless,” she said, “it’s that the forced change is small, and the variability is huge.”
Now here’s the part that she would normally mentor and coach a student to discover on their own, but since we’re talking hypotheticals here, we decided to let you in on the secret: if you’re able to work out how the physics of the system will shift the distribution of the processes responsible for producing precipitation, you could, in principle, do a much better job at estimating the tails. In a simple sense, think of it like this: if you have a historical distribution of rainfall that shifts a small amount (say 5%), that shift can translate into a much larger change at the tail. Your 1-in-100-year storm suddenly becomes 1-in-10.
Angie's Secret Recipe: There is no Secret Recipe
Experts like Angie know that there is no one-size-fits-all recipe for doing this. The relevant processes differ by region, by season, by storm type, and by the dynamics that actually deliver moisture to the area in question. The physics that matter for intense Caribbean rainfall are not the same as those driving heavy precipitation in the Pacific Northwest or the Great Plains. And so while the idea of shifting distributions is powerful, Angie emphasized that applying it responsibly requires understanding which physical mechanisms are operating, how they respond to warming, and how their variability interacts with the forced trend. Without that grounding, any attempt to model the tail will be little more than magical thinking dressed up as statistics.
There are many global precipitation datasets and reanalysis products, and each one was created by experts with specific goals, specific assumptions, and specific underlying observations. They are not interchangeable, and they are not neutral. A product optimized for one purpose may be poorly suited for another. For example, one research group might want to develop a longer precipitation record and consequently might need to tolerate coarser spatial resolution to do so, while another group might require ultra high resolution data to validate against satellite observations.
There may not be an ideal precipitation dataset for your particular end use at all. That’s where hard-won expert judgment comes into play: knowing which imperfections matter, which ones don’t, and which datasets can be trusted for which kinds of questions.
Similar considerations apply to climate models: they were not designed with the sole purpose of simulating global precipitation (or any other single variable) in mind. They are trying to solve the full circulation of energy, moisture, and momentum throughout the entire climate system—a massively coupled, multiscale problem. Precipitation is one consequence of those interactions, a fundamental component of the water and energy budgets to be sure, but not something the models tune directly to match any single observational dataset. Understanding this is part of expert judgment too: recognizing that precipitation is the emergent result of a system that conserves mass and energy under constraints that no single parameterization can perfectly capture.
It’s not that everything is impossible and nothing is certain, but you have to really know the data, the limitations, the observational uncertainties, as well as the physics, the circulation dynamics, and the strengths and limitations of the models. You also have to know your own code and any code you might inherit. It’s a lot to keep track of, and it speaks to the value of graduate-level training. Neither Angie nor I had any other solution to this problem besides “gumption.”
Gumption alone doesn’t forge scientists like Angie (though she has it to a greater degree than most). Exceptional climate science happens within an ecosystem of mentors, peers, advisors, instructors, methods, data products, and an enormous number of dead ends. As impressive as Angie’s accomplishments are at this early stage of her career, what stood out to me just as strongly was her tenacity and her willingness to keep plugging away at hard problems. She did so because she saw herself as a capable person who could and would do science—since “basically forever.”
See Other Posts in This Series
Through the Eyes of the Experts: A Taxonomy of Climate Model Uncertainty with Dr. Flavio Lehner
Through the Eyes of the Experts: Earth's Energy Imbalance with Dr. Daniele Visioni
Read More
Pendergrass, A. G. (2021). Warming impact on crops exacerbated by water. Nature Food, 2(9), 642–643. https://doi.org/10.1038/s43016-021-00344-3
Pendergrass, A. G., & Kao, W. H. K. (2024). Timescale dependence of the precipitation response to CO₂-induced warming in millennial-length climate simulations. Geophysical Research Letters, 51(21), e2024GL111609. https://doi.org/10.1029/2024GL111609
Pendergrass, A. G., Byrne, M. P., Watt-Meyer, O., Maher, P., & Webb, M. J. (2024). Impact of ITCZ width on global climate: ITCZ-MIP. Geoscientific Model Development, 17, 1–23. https://doi.org/10.5194/gmd-17-1-2024
Pendergrass, A. G., Kim, H., Kang, S. M., Lehner, F., Shin, Y., Ceppi, P., & Yeh, S.-W. (2025). Higher precipitation in East Asia and the western United States expected with future Southern Ocean warming. Nature Geoscience. https://doi.org/10.1038/s41561-025-01669-5
Pendergrass, A. G., Raiter, D., Polvani, L. M., Mitevski, I., & Orbe, C. (2023). Little change in apparent hydrological sensitivity at large CO₂ forcing. Geophysical Research Letters, 50(18), e2023GL104954. https://doi.org/10.1029/2023GL104954
Pendergrass, A. G., Kim, H., & Kang, S. M. (2022). The dependence of mean climate state on shortwave absorption by water vapor. Journal of Climate, 35(7), 2189–2207. https://doi.org/10.1175/JCLI-D-21-0408.1
Model independence & other topics
Brunner, L., Pendergrass, A. G., Lehner, F., Merrifield, A. L., Lorenz, R., & Knutti, R. (2020). Reduced global warming from CMIP6 projections when weighting models by performance and independence. Earth System Dynamics, 11(4), 995–1012. https://doi.org/10.5194/esd-11-995-2020
de Vries, I. E., Sippel, S., Pendergrass, A. G., & Knutti, R. (2023). Robust global detection of forced changes in mean and extreme precipitation despite observational disagreement on the magnitude of change. Earth System Dynamics, 14(1), 81–100. https://doi.org/10.5194/esd-14-81-2023
Chadwick, R., Pendergrass, A. G., Alves, L. M., & Moise, A. (2022). How do regional distributions of daily precipitation change under warming? Journal of Climate, 35(11), 3243–3260. https://doi.org/10.1175/JCLI-D-21-0505.1
Wood, R. R., Lehner, F., Pendergrass, A. G., Schlunegger, S., & Rodgers, K. B. (2021). Changes in precipitation variability across time scales in multiple global climate model large ensembles. Environmental Research Letters, 16(8), 084022. https://doi.org/10.1088/1748-9326/ac12f1