
A Watershed of Trees
Photo: Alexandra Moore
The Prince George’s County, MD Public Schools (PGCPS) environmental science curriculum was revised this year to include a series of Meaningful Watershed Education Experiences (MWEEs). This element of the curriculum revision is funded by a grant from NOAA B-WET (Bay Watershed Education and Training) to PGCPS and its professional development partner, the Paleontological Research Institution (PRI.) The MWEE sequence is centered on the role of trees in a watershed, as trees are a control on the movement of water and energy, and a powerful influence on both natural and human communities.
Download the Environmental Literacy Model (ELM) for this project here.
Video Resources
What is a MWEE?
MWEEs are the cornerstone for environmental literacy efforts in the Chesapeake Bay watershed. MWEEs connect standards-based classroom learning with outdoor field experiences to create a deeper understanding of the environment. Through MWEEs, students develop a sense of environmental ethics and stewardship that will be essential to the long-term sustainability of our local watersheds and will serve as the foundation of a lifelong relationship with the environment.
General MWEE resources, videos, activities, and training can be found at the Chesapeake Bay Program’s Bay Backpack website.
A MWEE consists of four essential elements that support investigations of local environmental issues that lead to informed action and civic engagement. It is a learner-centered approach that emphasizes the role of students in actively constructing meaning from learning experiences. It includes time for reflection, allowing students to refocus on how their learning and experiences affect a driving question.
A driving question addresses a locally relevant environmental issue, problem, or phenomenon requiring background research and investigation. Students learn more about the issue through in-class instruction and by making observations, collecting data, conducting experiments, talking to experts, and reviewing credible publications. Students identify, explore, and implement solutions for action.
For this MWEE, the project team has developed
A defining question
An outdoor field experience to be completed by all participants
A capstone experience, the district-wide Schoolyard Data Jam
Snapshot of Lesson Plan for A Watershed of Trees
(download full lesson plan here)
| Anchor Phenomenon | Does the presence or absence of trees create a measurable difference in physical environmental parameters (temperature, moisture) in an outdoor area? |
| Lesson/Investigating Phenomenon. How does this connect to the Anchor Phenomenon? | Trees are active modulators of their local environment, responsible for the movement of water and atmospheric gases (O₂, CO₂). This modulation is important for nearby human and natural communities. |
| Lesson Activities and Objectives | Students will work with their teacher to select two sites in their schoolyard (one shaded, one sunny) for year-long monitoring. Students will learn to use simple hand-held instrumentation to collect environmental data at their field sites. Students will collate and analyze their data for later presentation. |
The Four MWEE Elements
Click icons to learn more.
MWEE Element 1: Issue Definition
The issue is outlined in the defining question: “Within a human-dominated watershed, what are the impacts of trees on (1) water movement, (2) water quality, and (3) the creation of microclimates, and how do these processes influence the quality of life for human communities within the watershed?”
Students should engage in discussion, making sure they have access to appropriate background, ex. understanding of the hydrologic cycle.
Trees are chosen as the central element of this MWEE because: they are found at every school, they are surprisingly powerful, they are a bridge between human and natural communities, they provide rich curricular opportunities for additional exploration, they are an essential climate solution, and trees are an important component of the Prince George’s County Climate Action Plan.
-
The presence or absence of trees profoundly impacts water movement and water quality, with additional impacts on ambient temperature, habitat, and air quality. There are well-documented relationships between the extent of tree canopy in a community and the health and well-being of its residents.
-
Within a human-dominated watershed, what is the impact of trees on (1) water movement, (2) water quality, and (3) the creation of microclimates,and how do these processes influence the quality of life for human communities within the watershed?
-
Can we directly measure the movement of water in a tree or do we need to measure a related parameter? If so, what?
Standard(s):
NGSS LS2.B: Cycles of Matter and Energy Transfer in Ecosystems
-
How do we determine the effect of trees on water flow in the watershed? What data do we need to collect?
Standard(s):
NGSS LS2.B: Cycles of Matter and Energy Transfer in Ecosystems
NGSS ESS2.C The Roles of Water in Earth’s Surface Processes
-
What parameters define a microclimate? Can we measure these? Where should we measure?
Standard(s):
NGSS ESS2.D Weather and Climate
-
How often should we collect data?
Standard(s):
NGSS Scientific Practice (3) Planning and carrying out investigations
-
Do we want to collaborate with another school? If so which one, and how?
Standard(s):
NGSS Scientific Practice (3) Planning and carrying out investigations
-
How do we connect environmental parameters (beyond “pollution”) with the quality of life in a community? What community-level data do we need that we cannot collect ourselves?
Standard(s):
NGSS Scientific Practice (3) Planning and carrying out investigations
Learning Goals for MWEE Essential Element 1: Issue Definition
Students should be able to
Give a concise and accurate explanation of the global hydrologic cycle
Give a concise and accurate explanation of the carbon cycle
Connect carbon cycle and hydrologic cycle processes to the elements of their school setting
MWEE Element 2: Outdoor Field Experiences
To help ensure student success in the curriculum the project team has created a common set of observations for all environmental science students in the district. Completing a common set of core observations serves two purposes,
(1) to ensure that students have relevant data to address the driving question, and
(2) to create a common database shared between each school in the district, allowing county-wide investigation and comparisons.
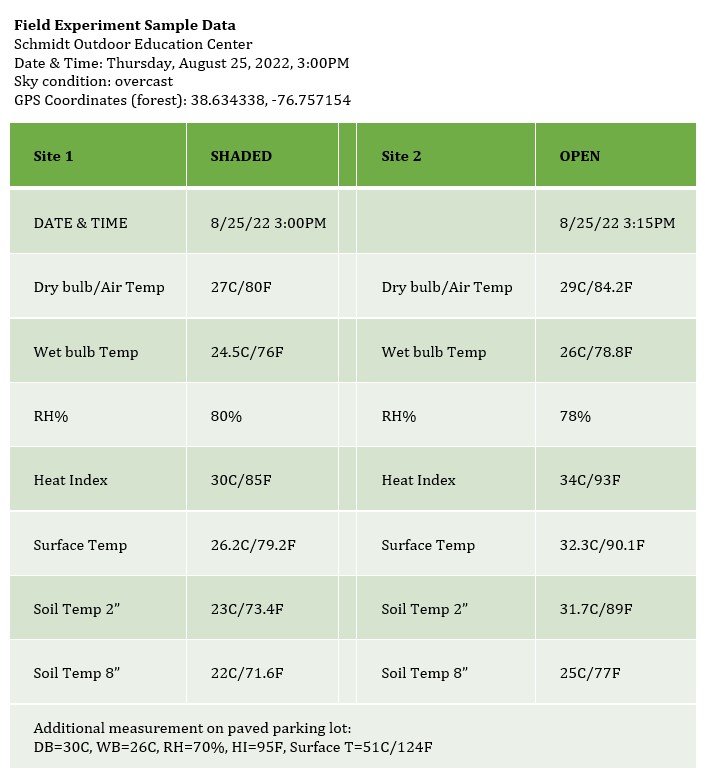
Field Experiment Design Summary
Paired field sites in each schoolyard: one sunny, one shaded
Measurements made 4 times/yr (+/- any daily/weekly replicates)
Air temperature, relative humidity (sling psychrometer)
Ground surface temperature (infrared thermometer)
Soil temperature profile (soil thermometers)
Soil moisture profile (moisture probes)
NOTE: in the first year of the project we will not measure the soil moisture profile; that element will be introduced in Year 2.
-
Planning the field work follows directly from the defining question and addresses the more specific details of actually working in the field:
• What is the status of instrumentation available to conduct experiments? Will we have to break into parameter-specific teams, or are there a sufficient number of devices for everyone to measure everything?
• How will data be recorded in the field, and is there a need to transfer the data to a digital format after the field work?
• How do we attribute specific measurements to specific individuals in case of needed follow-up? Will any of the measurements be influenced by user-bias?
• How will the data be stored so that all students have access to it?
• What happens if for some reason we can’t conduct all of our field measurements (extreme weather, covid restrictions etc.)?
The MWEE begins with a single experiment that all participating students in all 27 schools will complete: a paired-site study of a shaded and open microclimate, conducted 4 times through the school year, including measurements of air temperature, relative humidity, ground surface temperature, soil temperature at two depth (2cm, 15cm) and later, soil moisture. Students then have the opportunity to add additional elements to the MWEE, as appropriate to their local environment. Students in urban schools will likely ask different supporting questions than students in rural schools. Students will need to contextualize their observations with data from other sources; precipitation records, demographic data, land use maps. Students may also choose to conduct follow-up field experiments; eg. direct measurements of photosynthesis and/or water flow (in plants or adjacent streams). The purpose of installing continuous environmental monitors at the Schmidt Outdoor Education Center is to provide some of this context, as well as to be a backstop in the event that any individual school is unable to collect high-quality data at their location. -
Students and teachers should collaborate on choosing the field sites. The project is meant to take place on the school grounds to shorten the time spent coming -and-going, and to facilitate participation by students with mobility constraints. One site should be in an open, sunny space, while the second site should be under a tree, or trees, so that it is shaded for most or all of the day. Both sites need to have a soft substrate so that students can push the soil thermometers into the soil. If the soil is too firm, try to find a more suitable site, as super-hard soil can often break the stems of the soil thermometers.
At both sites students will make identical measurements and record their data. Data sheets are linked below, both paper and electronic. When all measurements are complete the data for the class will be added to a district-wide data website. While Celsius is usually the best choice of temperature units for science students, US residents are far more accustomed to seeing weather data in Fahrenheit, thus either (or both) may be used. Make sure to *always* record units!
If circumstances permit, students can be encouraged to record data at additional sites – for example – making surface temperature & humidity measurements on a sidewalk or parking lot will provide additional insight into the temperature distribution across the schoolyard, even though subsurface temperatures cannot be measured on impermeable surfaces. -
Supplemental Data: In addition to the data acquired by students with hand-held instruments long-term environmental monitors are scheduled to be installed at the PGCPS William S. Schmidt Outdoor Education Center. The same set of measurements (air temp, RH, sunlight, soil temp profile 0-100cm, soil moisture) will be made via continuous data loggers in two locations, one shaded, one open, using a cellular data connection to report data for display. Additionally, we will install a wifi-connected outdoor air quality monitor at the center headquarters to continuously monitor temperature, relative humidity, barometric pressure, atmospheric CO2 concentration, particulate concentrations, (PM1.0, 2.5, 10.0), and volatile organic compounds. These data will help students contextualize their own measurements and provide a long-term continuous record of climate parameters for the county. Students can compare their individual discrete measurements to the continuous record from the Schmidt Center to better understand the dynamic behavior of trees in the watershed.
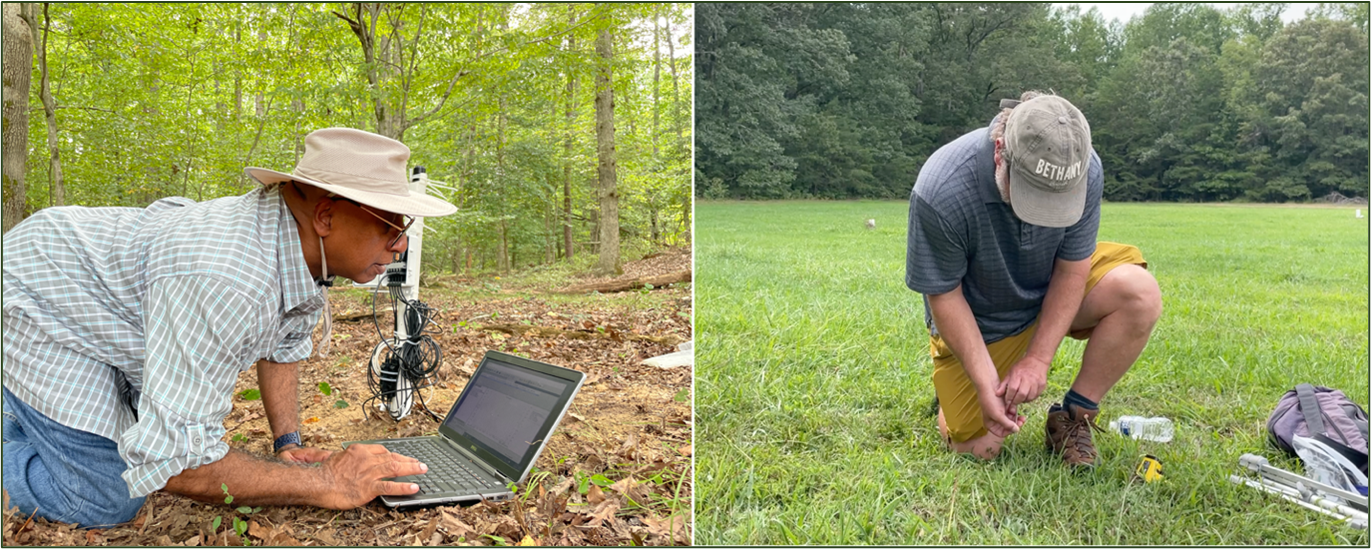
Photos: MWEE demonstration sites at the Schmidt Outdoor Education Center. Left, Dr. Godfrey Rangasammy works at the shaded site, while Right, Dr. Kurt Lienau measures soil temperature at the open site. The two sites are approximately 50 yards apart.
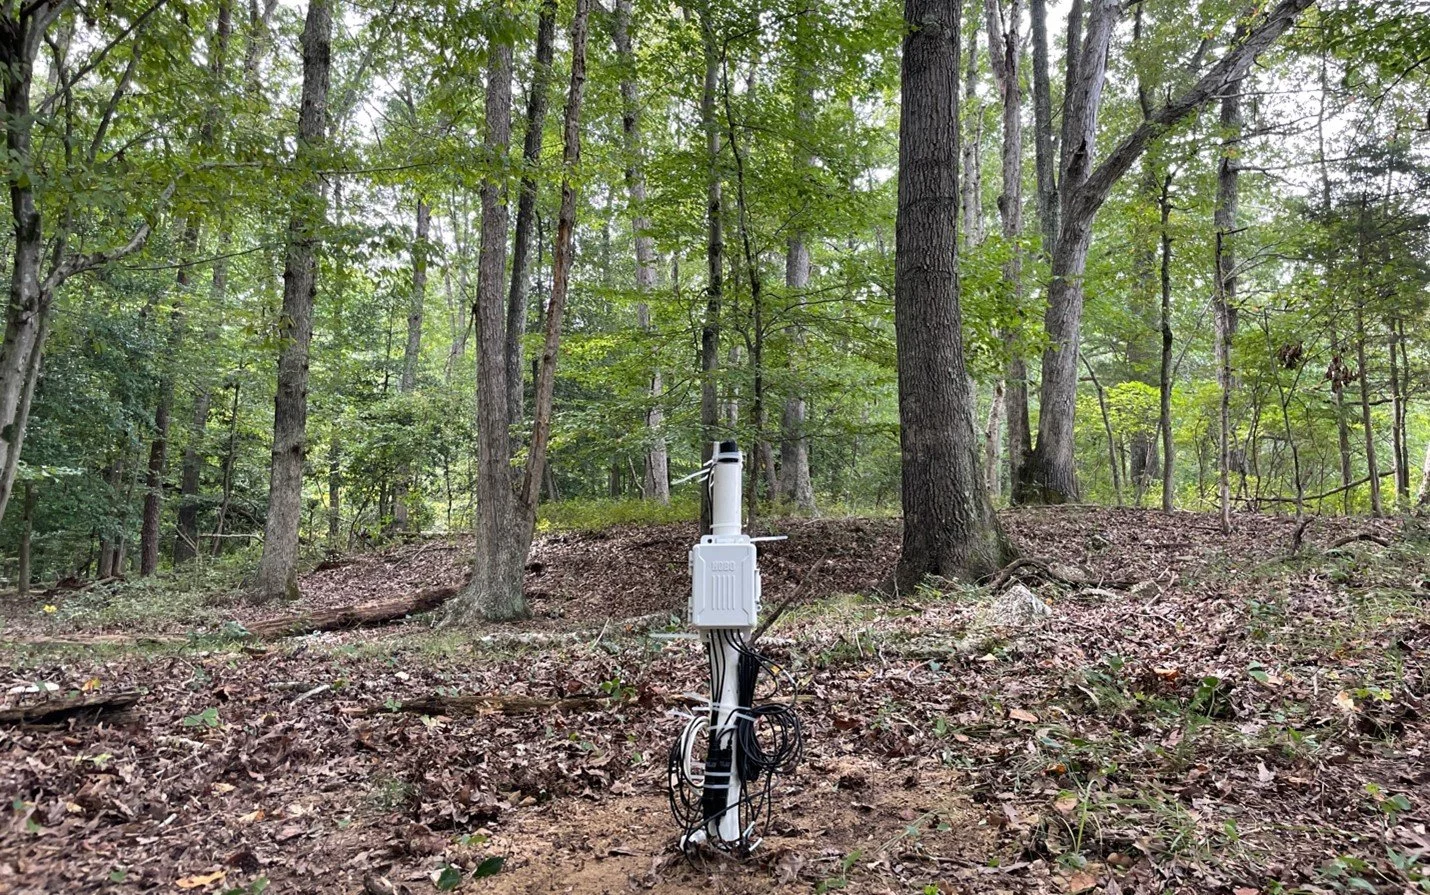
Automated environmental data logger installed at the Schmidt Outdoor Education Center.
Learning Goals for MWEE Essential Element 2: Outdoor Field Experiences
Students should be able to
Create appropriate graphical representations of field data
Give a concise and accurate explanation of photosynthesis
Explain the role of latent heat in the phase change from liquid water to water vapor
Explain the role of trees in controlling ambient temperature, relative humidity, and soil moisture
MWEE Element 3: Synthesis and Conclusions
In brief, students identify, synthesize, and apply evidence from their investigations to draw conclusions and make claims about the issue, problem, or phenomenon. Students communicate these conclusions and claims to internal and external audiences in venues that may range from the school classroom to the larger public community.
Analyzing and Interpreting Data
Students will have, at minimum, time series data for 5 parameters at 2 sites measured in 4 seasons. These data are best analyzed in graphical format. In order to draw robust conclusions students may also consider examining their data in the context of regional environmental parameters (eg. rainfall, watershed data, historical temperature records) which could require representation in additional formats (eg. maps/geospatial). Students may also choose to incorporate data from other schools in the district. It is important to devote class time to analysis in the period immediately following each field experience, as issues of importance are top-of-mind, and any oversights or necessary follow-up can be addressed as soon as possible. As this project includes three foci – trees, water, and people – the students’ data analysis offers opportunities to address one or all of these elements.
The transition from a table of measured values to a representation that quickly and effectively communicates the importance of the project is an essential element of scientific inquiry. The representation does not need to be sophisticated of hi-tech. But some form of graphical analysis is very helpful in making the project accessible to those who did not participate (and sometimes even to those who did). Because the Watershed of Trees MWEE is conducted across the four seasons of the school year, time is one important element to consider in representing data. Similarly, because the project takes place in two locations, and at all 28 high schools in the district, space is another important element.
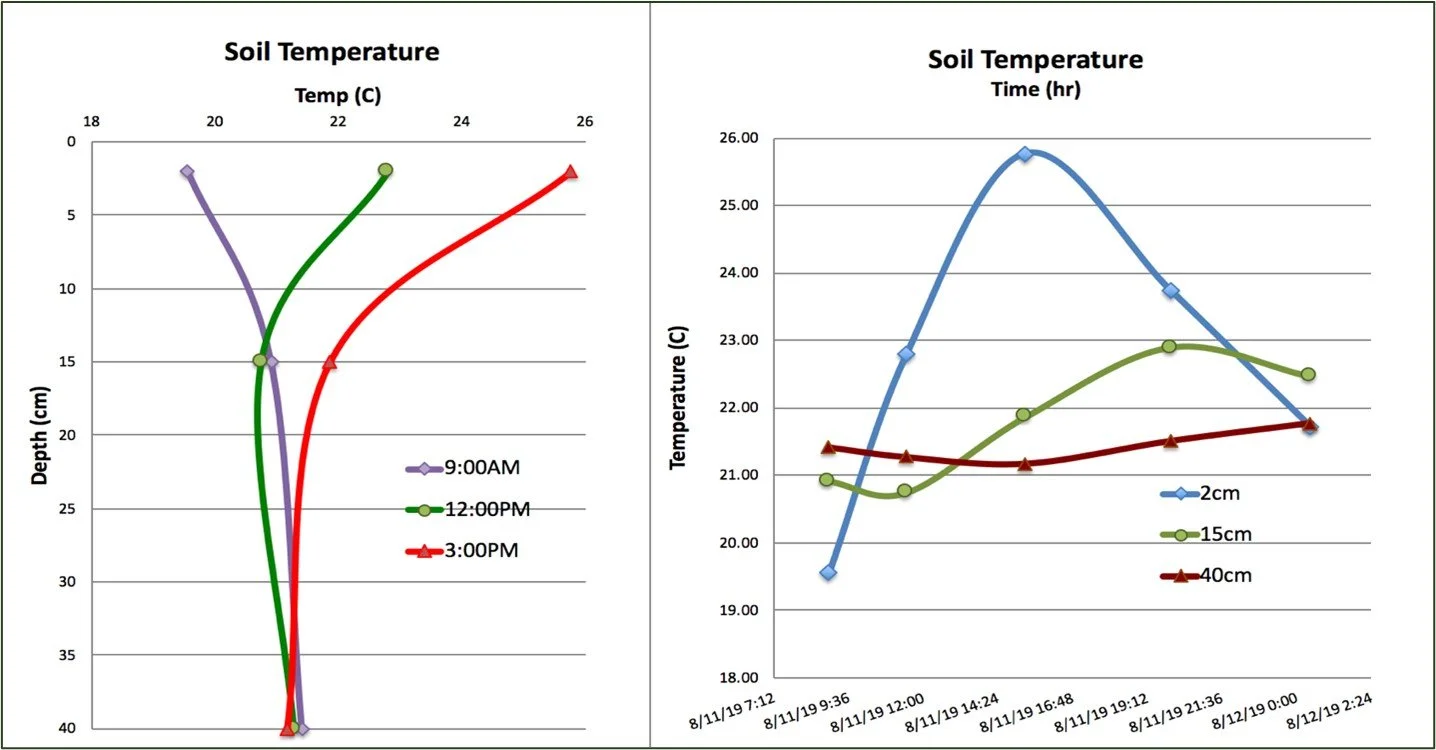
Samples of graphical presentation of soil temperature data (note, these data include a third measurement at 40cm depth). Left: data presented as a temperature profile, with temperature on the x-axis and depth (increasing downward) on the y-axis. These data were measured at three different times of day and plotted together to show the daily variation. Right: Soil temperature data presented as a time series, with time of day on the x-axis and temperature on the y-axis. Similar conclusions can be drawn from both representation; (1) the temperature variation at the surface is larger than at depth, (2) changes at depth lag behind changes at the surface.
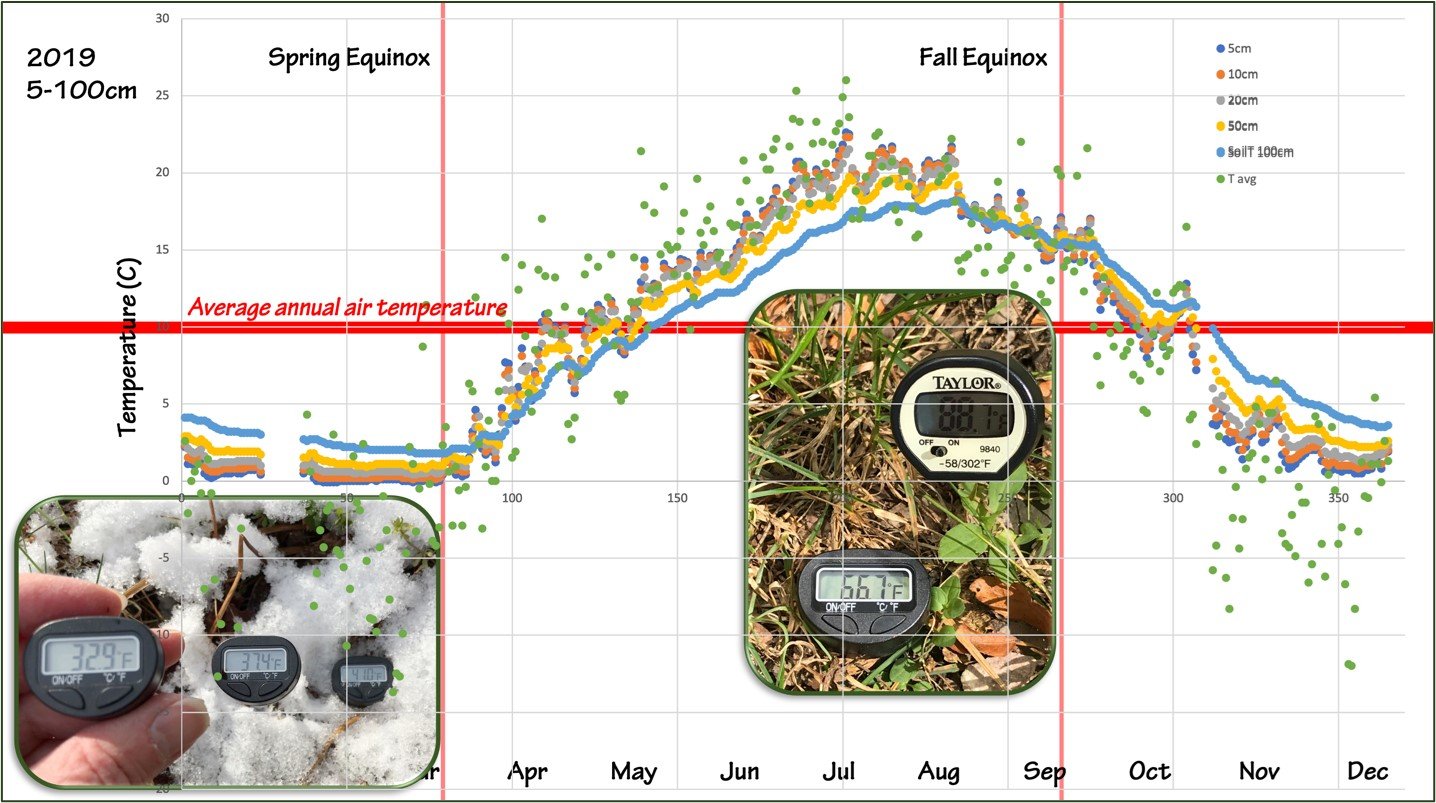
Change through time. Sample data acquired from the US Climate Reference Network (https://www.atdd.noaa.gov/u-s-crn-groups-map/). These data show a one year time series of soil temperature measurements, from 5cm to 100cm depth, and corresponding air temperatures, in central New York state. Student measurements are shown in the inset photos in winter and summer. Additional conclusions that could be drawn from a long-term record include (1) the shallow temperature is always warmer than the deep temperature in spring and summer, while the deep temperature is always warmer than the shallow temperature in fall and winter, and (2) the soil temperatures are always more stable (less variable) than the air temperatures.
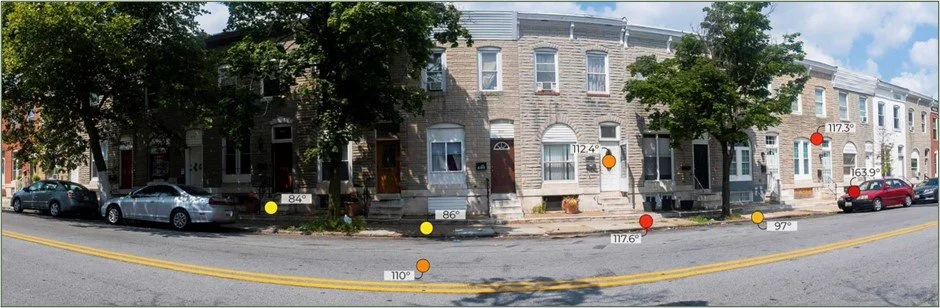
Change across space. Sample surface temperature measurements, Baltimore MD, August 1, 2019, 11:20AM https://cnsmaryland.org/interactives/summer-2019/code-red/neighborhood-heat-inequality.html#story The data here show measurements made with an infrared thermometer across a city block. The influence of trees on the surface temperature is clear, and has important consequences for the residents of this neighborhood.
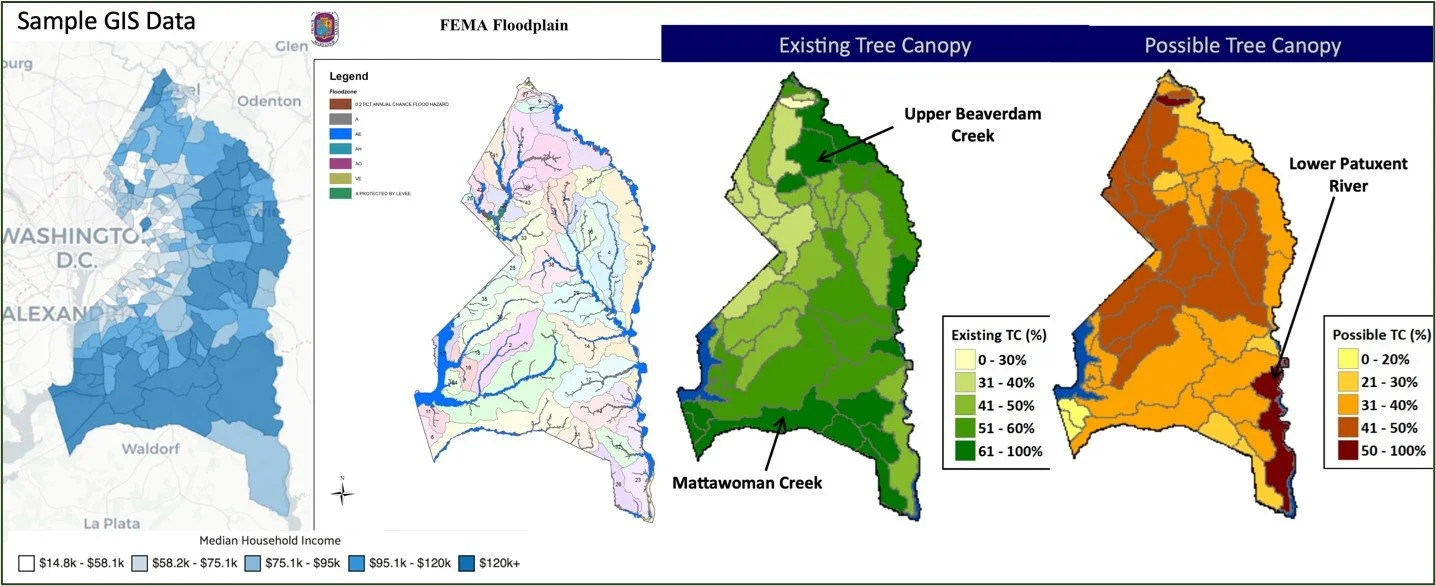
What else is going on in Prince George’s County? Students could use geographic and demographic data to support their MWEE project. (A) Median household income (B) FEMA Floodplain map, (C) Tree canopy fraction by watershed and (D) canopy restoration proposal.
Learning Goals for MWEE Essential Element 3: Synthesis & Conclusions
Students should be able to
Explain the design and execution of their field project
Explain the relationship between tree canopy and the movement of water and energy in the local environment
Describe the relationship between tree canopy and human health and energy use
MWEE Element 4: Action Project
Students identify, explore, and implement solutions for action. The solutions address conclusions and claims drawn through investigation and action projects. Students reflect on the action and determine the extent to which the action successfully addressed the problem, challenge, or phenomenon reflected in the claim. Students may also share proposals for sustaining or extending the action.
The Watershed of Trees MWEE engages students in three elements, (1) the role of trees (2) in the watershed (3) and their impact on humans. Consequently, the students’ Environmental Action Projects will likely focus on one of those three areas. We propose the following process for transitioning from student-collected data to student-designed action:
| Activity | Outcome |
|---|---|
| Brainstorm: which element, trees, water or people do students wish to focus on? And should the action project be undertaken as a class, in small groups, or as individuals? | Students should determine what size group(s) to work in and what area – broadly – they would like their action plant to address. |
| Identify community stakeholders who could be asked to assist, and/or help define the scope of the project. | Invite stakeholders to provide input; refine Action Project. |
| Review PGC Climate Action Plan. How might the class Environmental Action Project fit within the context of the county plan? | Refine Action Project. |
| Draft a description of the proposed Environmental Action Project. | Present draft to teacher (and/or community stakeholders) for comment/revision. |
| Identify any additional resources that might be necessary and create a timeline for action. | Ensure that the project is on a feasible path to completion. |
| Act! | Culminating Activity: District-wide Schoolyard Data Jam |
Constructing and Communicating a Claim
This MWEE is designed to guide students through the underlying scientific phenomena behind the PGC Climate Action Plan’s recommendation to expand tree canopy cover in the county (PGC CAP, 2022). The students’ data should allow them to make quantitative arguments about the impact of trees on the movement of water and the range of microclimates observed within the county. These conclusions will be presented locally at the year-end Schoolyard Data Jam, and will be made available to all on a project exhibit website curated by PRI.
Identifying Solutions
The integration of students’ data collection with the articulated needs of Prince George’s County in the PGC Climate Action Plan is meant to support the student groups as they brainstorm solutions to issues informed by their data. Several of the members of the Climate Action Committee are members of the PGCPS community, and are ready to help the students articulate their plans, and to connect the students with appropriate resources. Similarly, the PRI/PGCPS project team will help students identify effective solutions that are appropriate for the community.
Designing a Plan and Taking Informed Action
There is a wide range of actions available to students, as their data inform a suite of physical processes and their impacts on human communities. As we have centered the project on trees we anticipate that one or more student groups will want to plant trees in support of the county-wide goal to increase tree canopy. To this end, the county has an array of funded resources available, and PGCPS has already identified a number of partners to help students make Environmental Action Projects successful. Additionally, this MWEE lays the groundwork for exploration of environmental justice issues in PGC.
Learning Goals for MWEE Essential Element 4: Environmental Action Project
Students should be able to
Place the data they have collected in the context of a local environmental issue
Organize and execute an action project
Effectively communicate project structure and outcomes in written and oral formats